
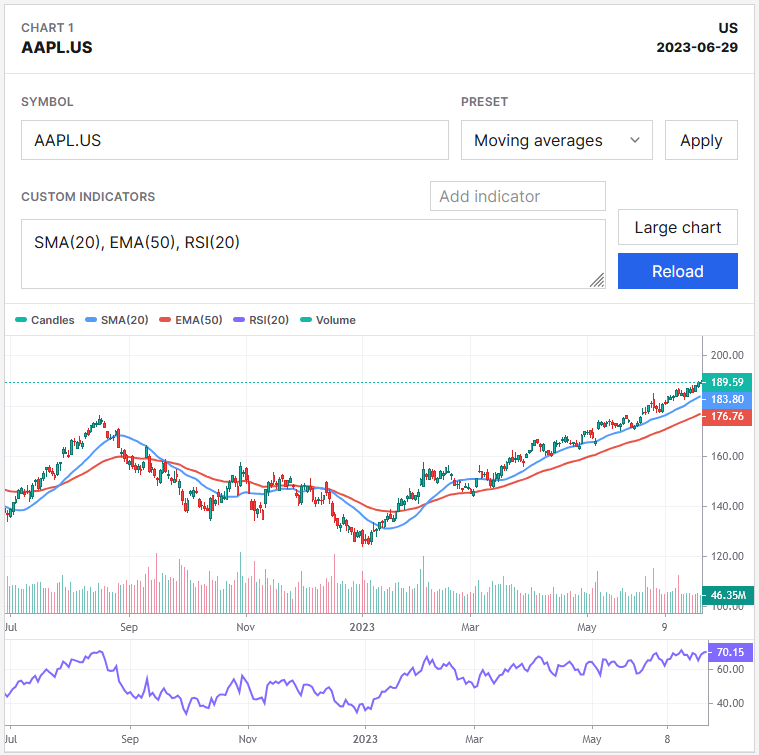
Technical analysis is most useful when it helps you compare a small set of names quickly without losing the context behind each chart. The new Technical Analysis workspace keeps that work in one EOD research desk: choose the market, set the date and history window, then review one or several symbols side by side.
The workspace is built for research and review. It does not create orders or turn a chart pattern into a trade decision. It gives you a consistent way to inspect price, volume, and studies before you decide whether a name belongs in a watchlist, a screen, or a deeper Symbol Review.
Compare the right number of charts
Start with the grid control. You can choose one, two, four, six, or eight charts. Use one chart when you are studying a single candidate in detail. Use four or more when you want to compare related names, a sector group, or the top results from a screen.
The quick-grid controls make it easy to change the layout without rebuilding the research setup. Each chart keeps its own symbol and indicator list, so moving from four charts to two is a layout decision rather than a new workflow.
Set the EOD date and history window first
The controls above the chart grid define the shared chart context:
- EOD date: Review the workspace as of a selected end-of-day date.
- History length: Choose 3 months, 6 months, 1 year, 2 years, or 3 years of history.
- Volume: Volume remains visible as part of the price chart context.
Use a shorter window when you are checking recent momentum or a pullback. Use one to three years when you need to see a larger trend, prior bases, or how an indicator behaved through different market conditions. The selected EOD date is shared across the grid so the comparisons remain consistent.
Find symbols by ticker or company name
Each chart has its own symbol field with search suggestions. Start typing a ticker such as AAPL, or type a company name such as Apple Inc.. Results are scoped to the market tab you are using, so US, Canada, India, and Australia do not get mixed together.
Select a suggestion with the mouse or keyboard. The chart reloads for that symbol while the other charts remain unchanged. This is useful when you have a fixed comparison set and only want to swap one name at a time.
Use presets, then edit the chart you are looking at
Presets are a quick starting point, not a global setting. A moving-average chart can sit beside a momentum chart or a volatility chart because every card has its own preset and custom indicator list.
The custom indicator field is intentionally a list of indicator calls, not a screener expression. Use commas to keep the field compact:
Another example:
Do not put comparisons, brackets, or AND/OR logic in this field. Those belong in the screener. The chart list only tells the workspace which studies to draw.
Search and add an indicator without leaving the chart
The small Add indicator search beside the list helps when you do not remember a function name. Search for a study, select it, and the workspace inserts a valid function call directly into that chart's comma-separated list. You can then adjust its parameters before reloading.
The picker only returns chart-drawable studies available on your account tier. That keeps the list aligned with the backend parser and prevents the workspace from suggesting indicators it cannot render.
Keep price studies and oscillators readable
Not every indicator belongs on the price scale. Moving averages, bands, and channels remain on the main price chart. Oscillators and volatility studies use their own panels below the chart with separate axes. This avoids the common problem where an RSI or ATR distorts the price range and makes the candles unreadable.
The legend has its own row above the chart area, so it does not cover the plotted data. Volume stays in the main chart context while lower-panel studies retain their own scale.
Follow the same bar across every panel
The chart cursor is synchronized across the price pane and all sub-indicator panes. Hover any pane and the crosshair moves to the same timestamp in the other panes. That makes it easier to answer practical questions such as: what did RSI, ATR, or another oscillator look like on the day price broke out, pulled back, or reversed?
This synchronization matters most when you use more than one lower-panel study. You can inspect the same bar across price, volume, and each indicator without manually lining up separate charts.
Reload is explicit and runs in the background
After changing a symbol, date, history length, or indicator list, use Reload on the relevant chart. The button shows a loading state while the chart request is processed in the background, then returns to its normal state when the updated data is ready.
Custom indicator entries are validated by the chart backend before they are compiled. If an entry is malformed, unknown, or not drawable, the chart still returns its price and volume data and an error appears directly below the indicator field. Fix the listed entry and reload again. You do not need to guess whether the issue was the symbol, the chart, or the indicator syntax.
Open a larger chart when one name needs more attention
The Large chart action opens the current card in a dedicated view while preserving its symbol, date, history window, and indicator list. Use the grid for comparison, then open the larger view when one candidate deserves a more deliberate read.
A practical review routine
- Open Technical Analysis from Research and select the market tab.
- Set the EOD date and a one-year history window for a normal daily review.
- Choose a four-chart grid.
- Search for four candidates from a screener result or watchlist.
- Start with a moving-average preset, then add one or two studies that answer a specific question.
- Use the synchronized cursor to compare the same price bar with each lower-panel indicator.
- Open the strongest candidate in a large chart or move it to Symbol Review for the broader evidence.
The goal is not to add as many indicators as possible. Start with price and volume, then add studies only when they clarify a specific part of the setup. A smaller, consistent chart template is usually more useful than a crowded chart with conflicting signals.
Open the Technical Analysis workspace to begin a focused EOD review.