Skip to content
EZStockScreener
Trader research desk

EZStockScreener

Find tradeable stocks with technical, fundamental, and hybrid screens. Review matched symbols, save watchlists, backtest ideas, and export a TradesViz-ready plan from the same workflow.

101+ technical indicators and functions
156+ fundamental metrics
4 supported markets
Infinite opportunities
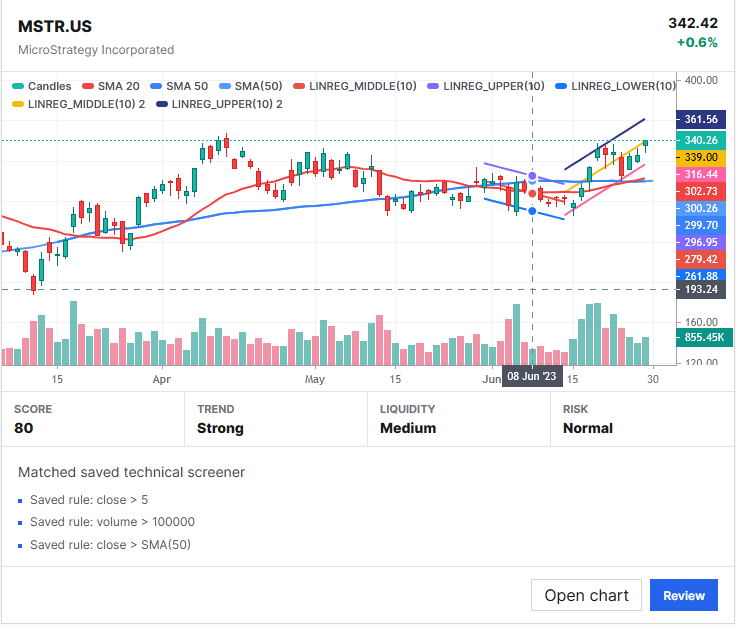
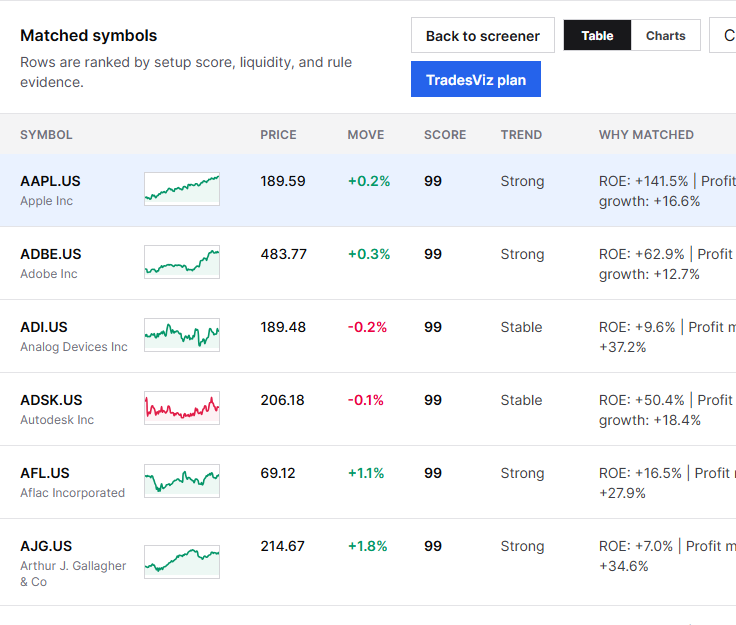
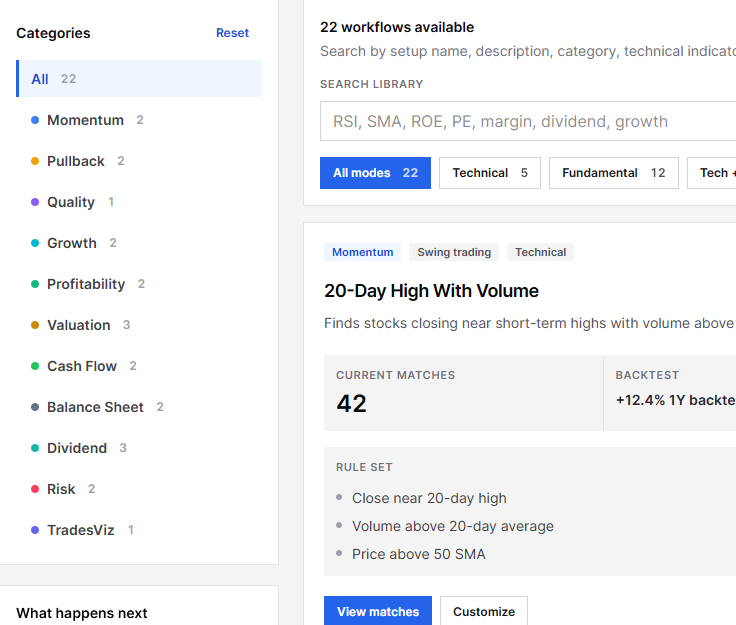
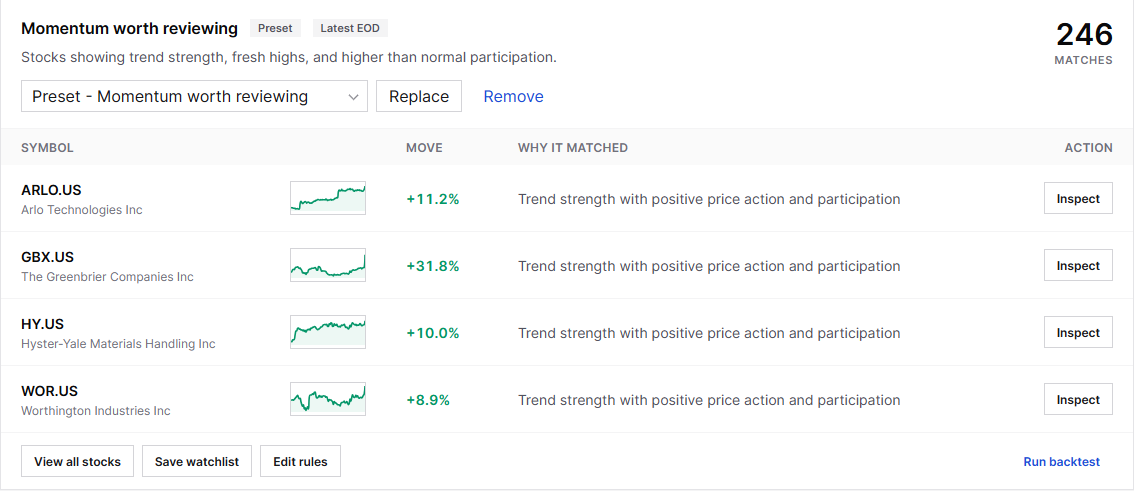
Symbol review chart with matched screener evidence Matched symbols table ranked by score and trend Screen library with searchable workflow categories
Same team

From the creators of the world’s most comprehensive trading journal

EZStockScreener is built by the team behind TradesViz, the journal traders use to analyze stock, option, futures, and forex trades with hundreds of automatic charts, stats, and reports. Screen here, journal there, one continuous workflow.

100M+ trades analyzed
200k+ traders served
50+ broker integrations
300+ automatic charts and reports
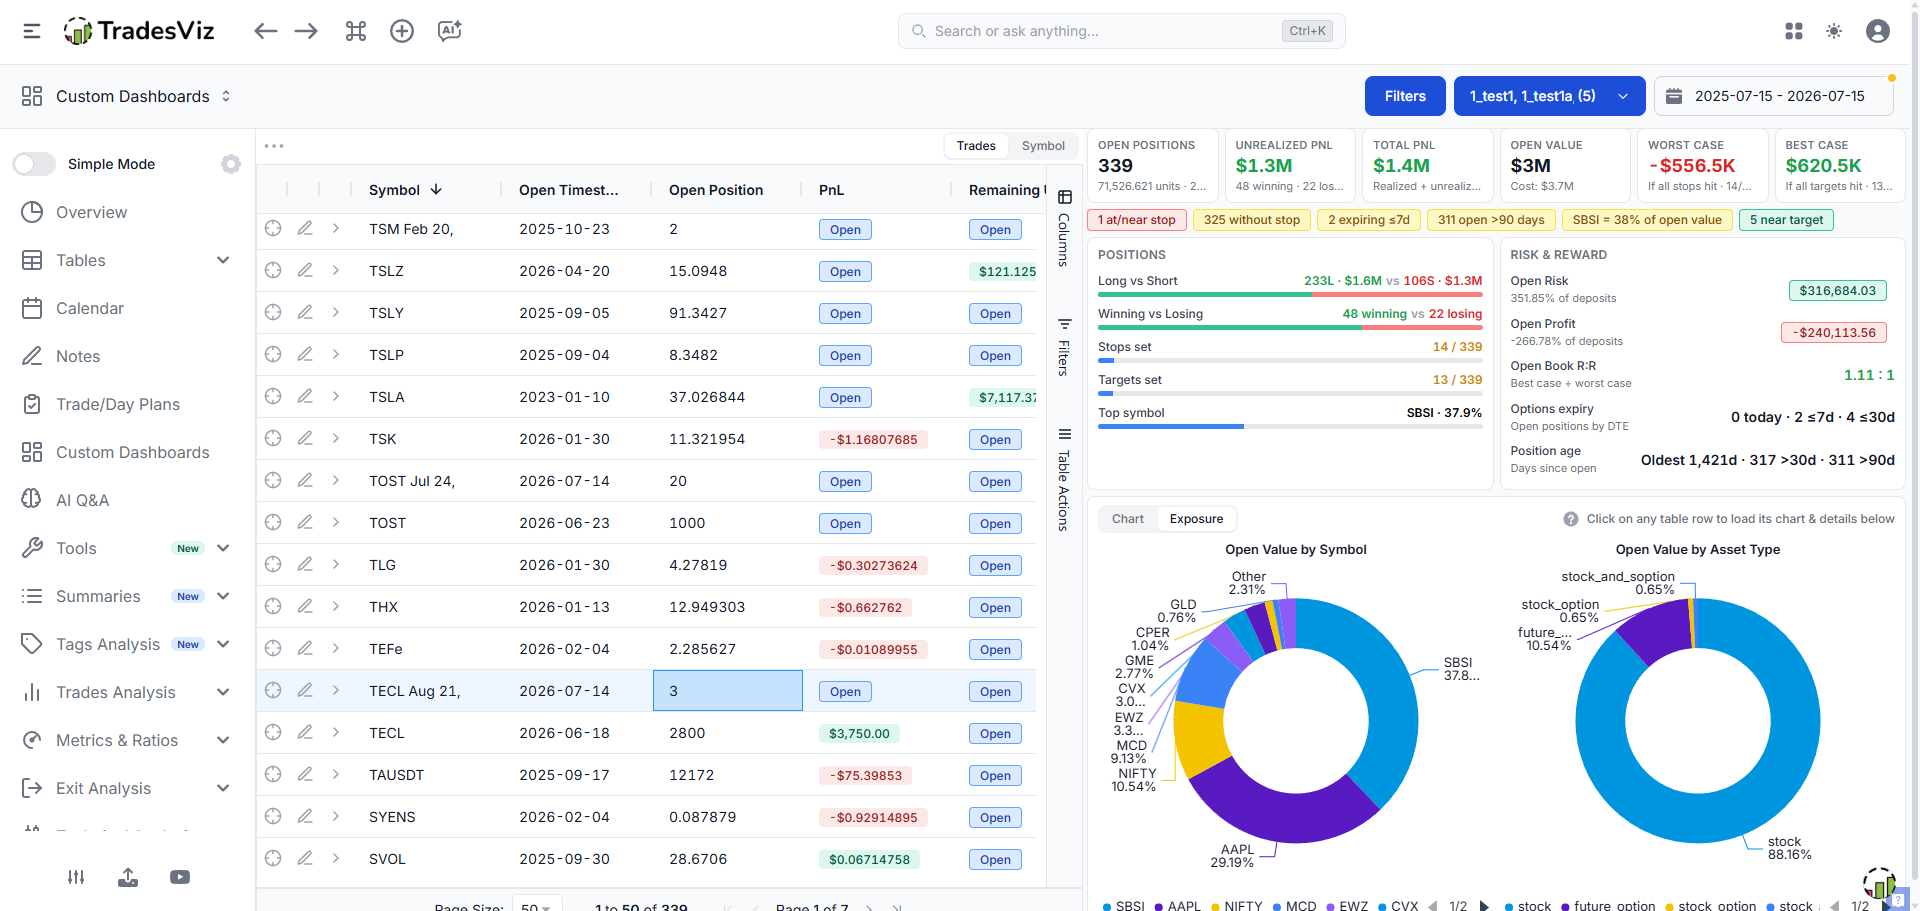
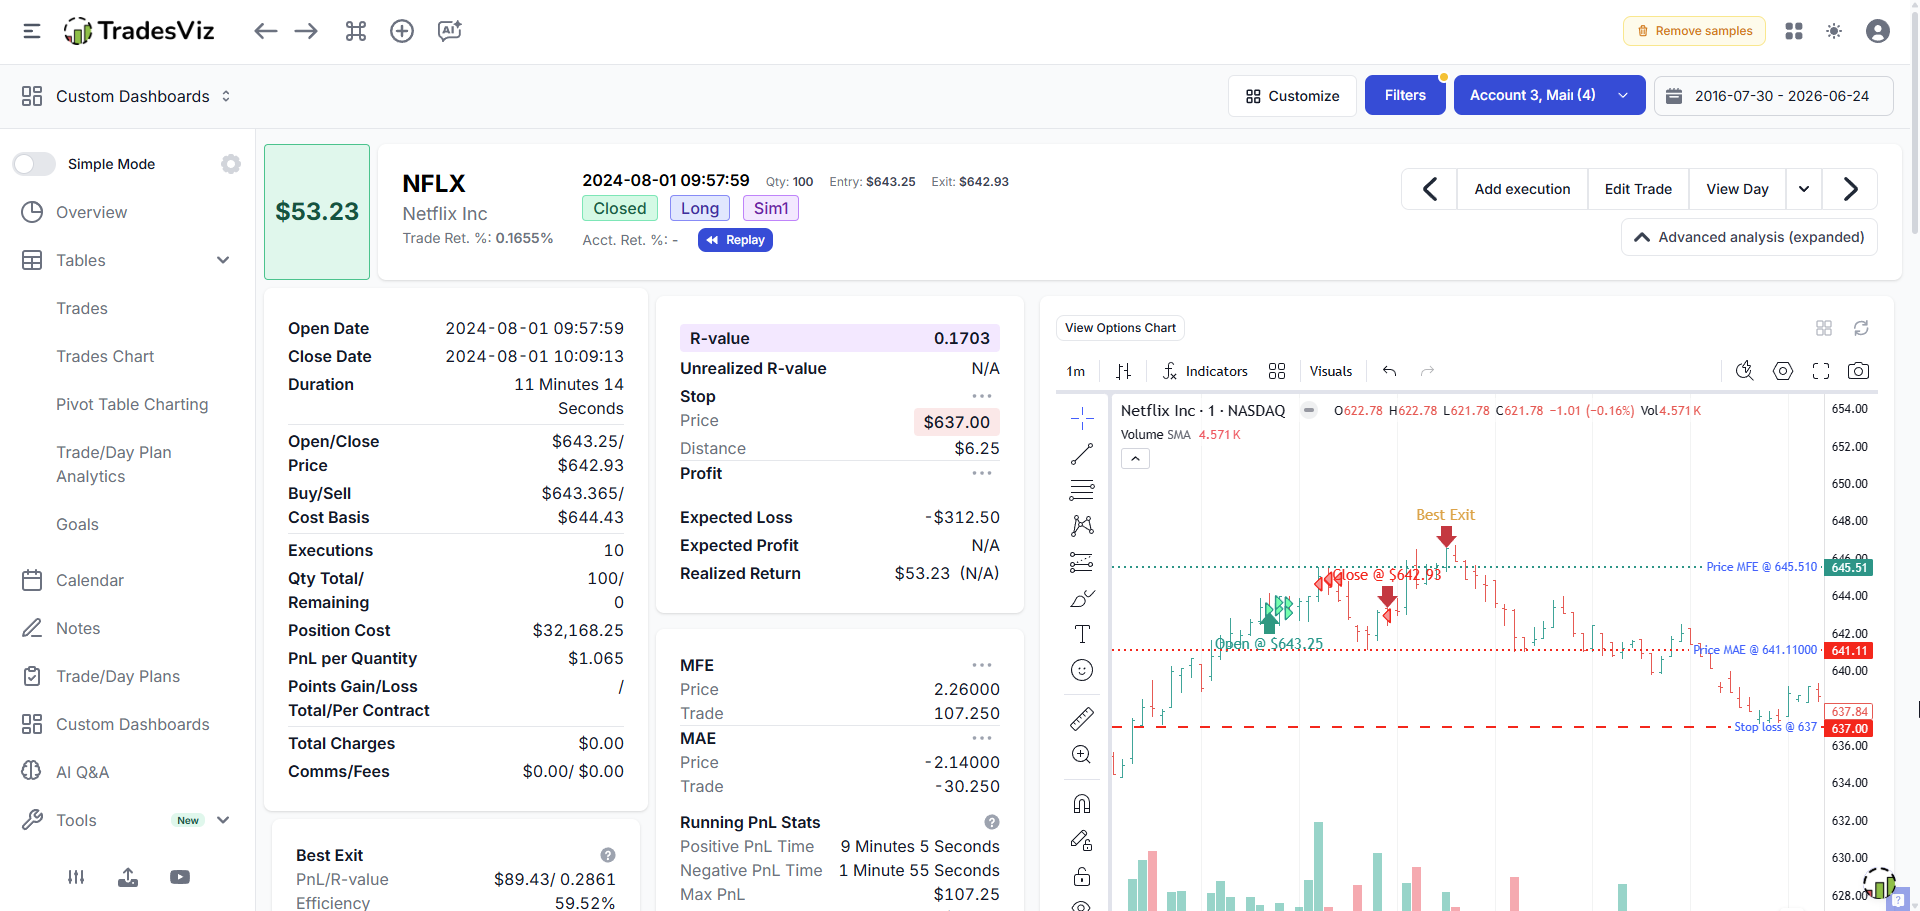
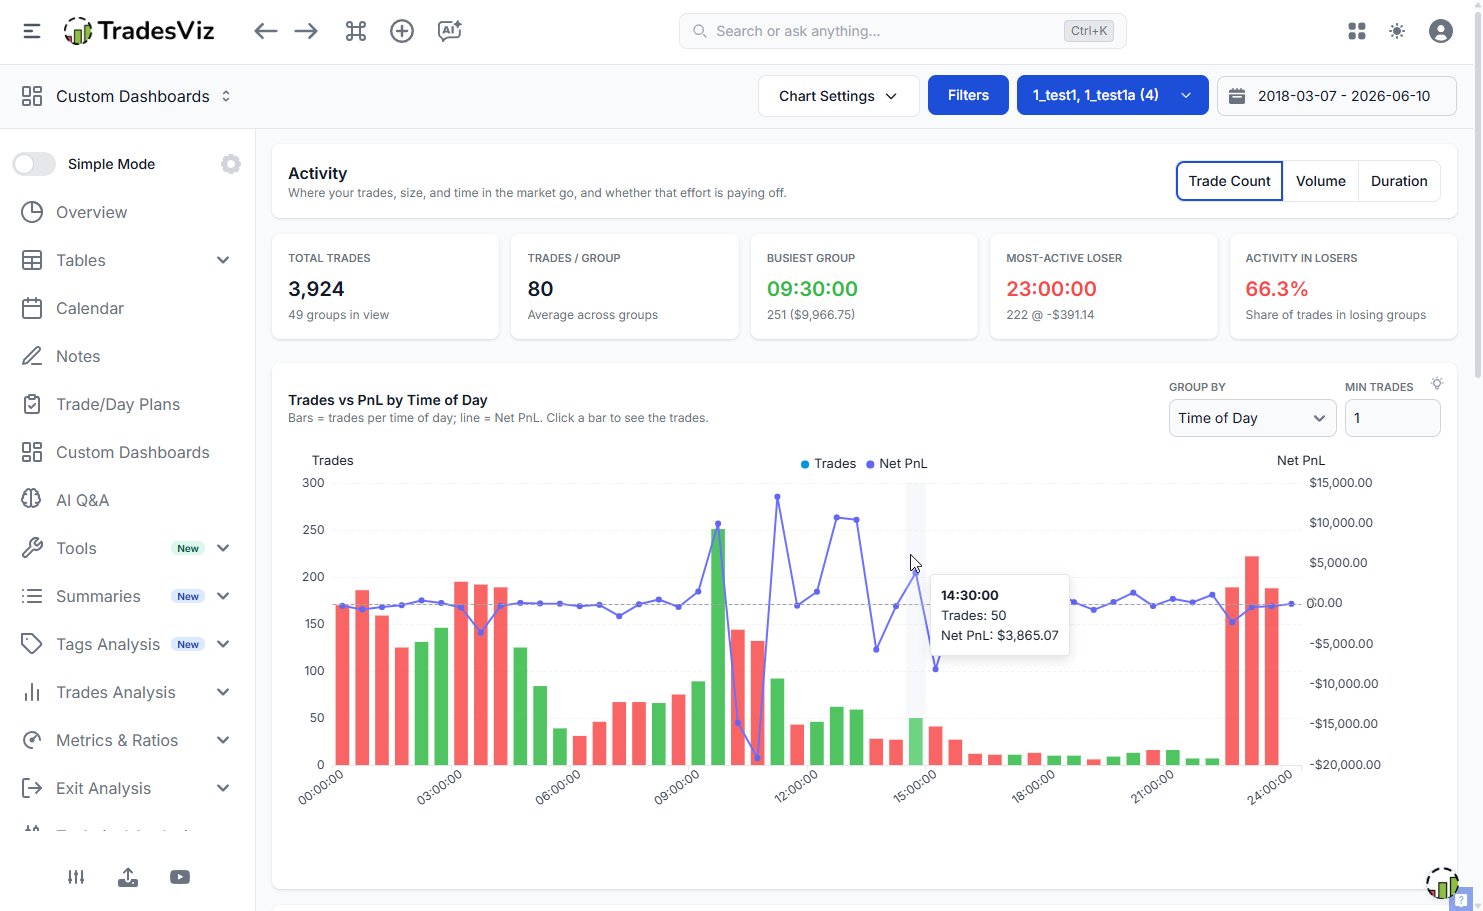
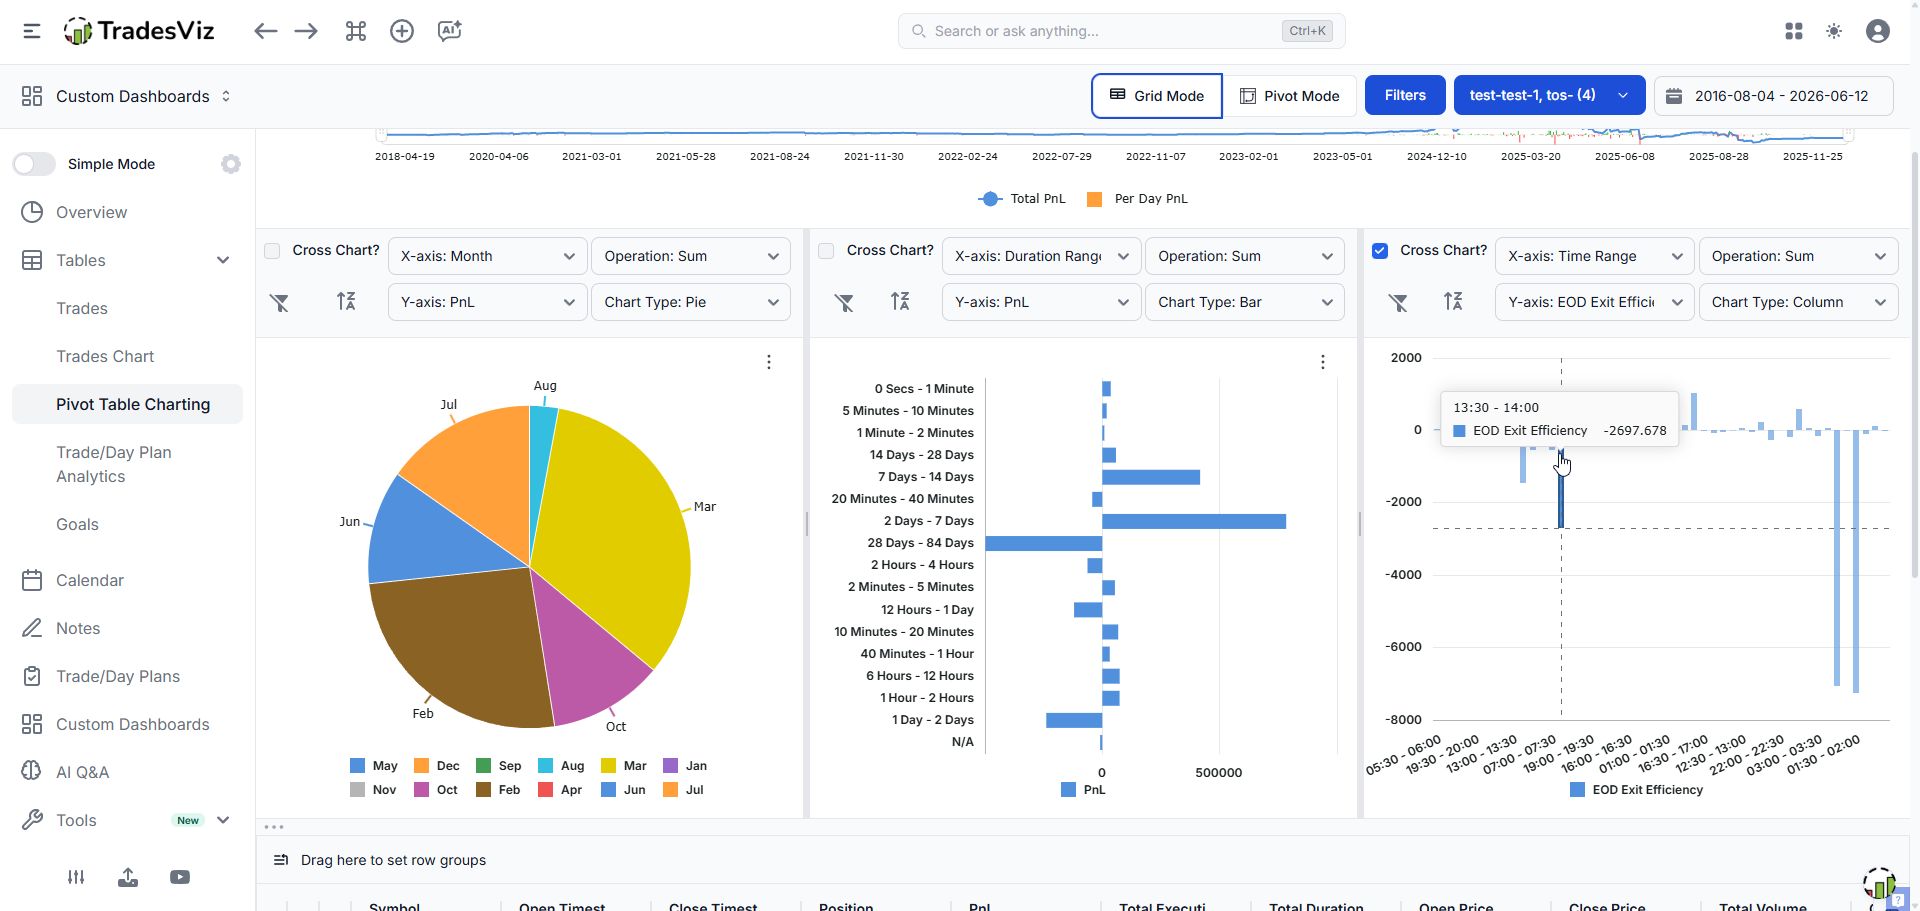
TradesViz custom dashboard with open positions, risk and reward, and exposure charts TradesViz trade detail view with execution chart, MFE and MAE, and running P&L stats TradesViz activity report showing trades versus net P&L by time of day TradesViz pivot table charting with cross charts for P&L by month, duration, and time range
Examples

Build real screens, inspect the matches, and keep the useful results.

Use plain English, query syntax, presets, or saved base screeners. Results flow into queues, charts, symbol review, watchlists, backtests, and exports.

Momentum Gap-up names with rising volume

Stocks that have moved more than 10% in the last three sessions while volume is increasing.

[CHANGE(close, change_by=10, change_type='perc', period=3)]
AND [TREND(volume, period=3, direction='increasing')]
Example output MELI AVGO CMG MTD
Hybrid Quality companies with tradeable pullbacks

Combine fundamental quality, valuation, and technical price behavior in the same screen.

[PE_RATIO < 25]
AND [RETURN_ON_EQUITY > 15]
AND [RSI(14) < 45]
AND [close > SMA(200)]
Review queue Priority Watchlist-ready Risk review
AI assist Convert a trading idea into query syntax

Start from a written idea, edit the generated query, then save it as a reusable screener.

Find liquid US stocks under 50 where MACD crossed up
and RSI is recovering from oversold.
Next steps Save Backtest Export CSV
Backtester Check how a saved strategy behaved

Run entry and exit screeners on historical data, then inspect the matched trades before turning an idea into a routine.

Entry: [CROSSED(SMA(20), SMA(200), direction='above')]
Exit: [RSI(14) > 70]
Market: United States
Backtest output Trades Return Max move CSV
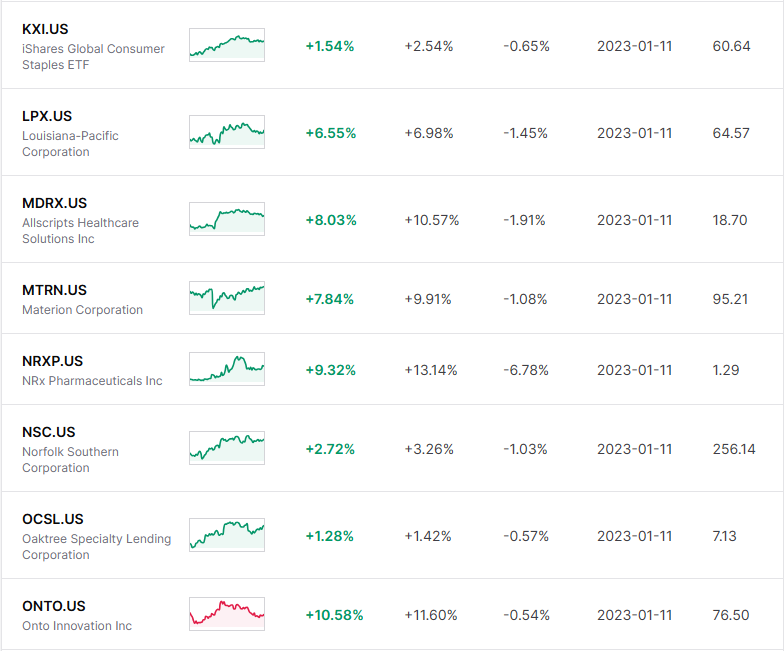
Example screener result symbols
Matched symbols ready for review
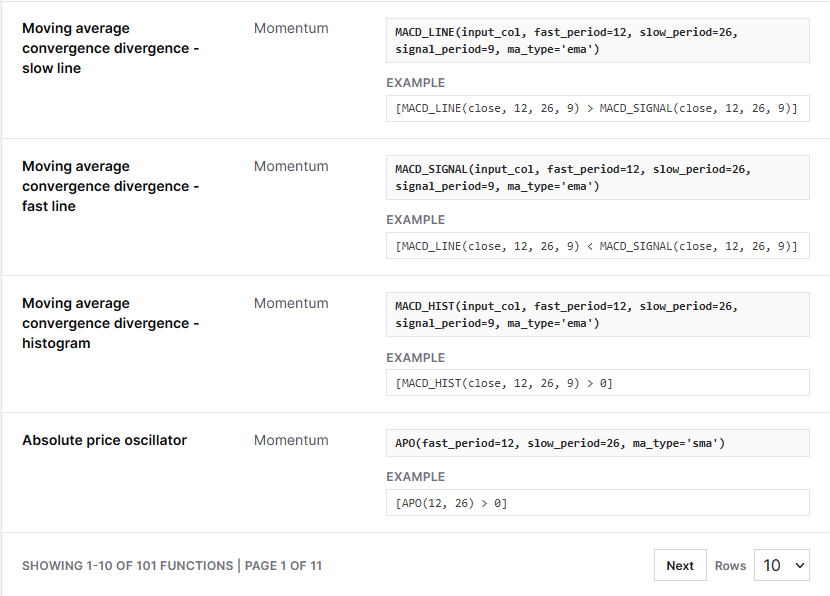
Indicator reference examples
Indicator syntax and examples
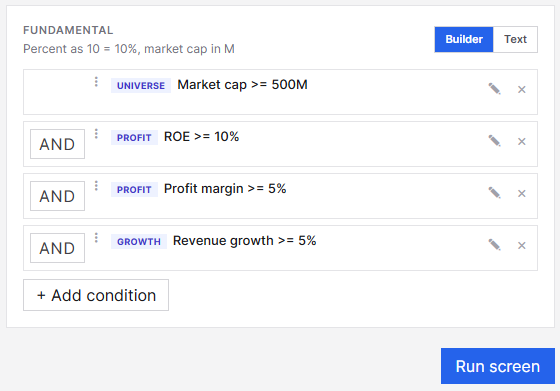
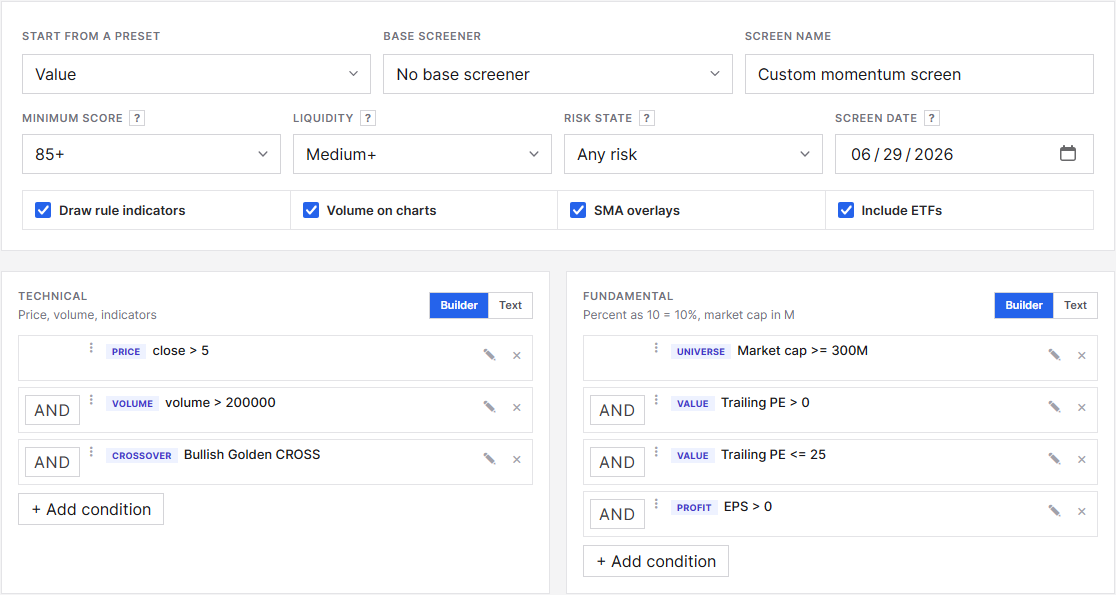
Fundamental screener rule builder
Fundamental and hybrid rules
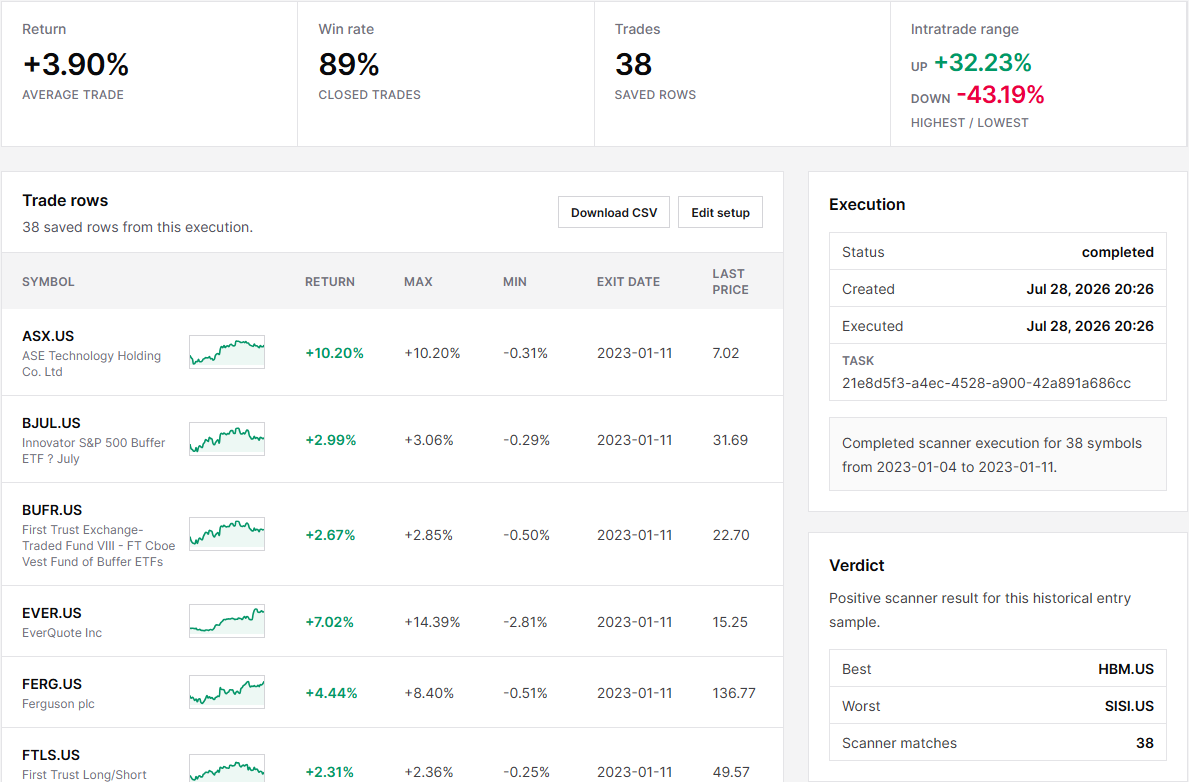
Backtest results table screenshot
Backtester results with entries, exits, returns, and CSV export
Backtester

Validate a screen before it becomes part of your process.

Use saved screeners as entry and exit signals, run them across historical end-of-day data, then review matched trades with return, move, exit date, and volume context.

Entry and exit logic Use the same query system you use for daily screens.
Result table Inspect symbols, sectors, scan dates, exit dates, returns, and volume.
Exportable output Download rows for deeper review or a TradesViz planning workflow.
EZStockScreener backtester results screenshot
Strategy backtester Entries, exits, returns, export
Workflow

Start with the market, finish with a review queue.

The new v2 surface is organized around the real daily research loop: discover, screen, inspect, save, backtest, and plan.

Create account

Market Pulse

Open with market breadth, curated screen sections, and direct inspect links for the symbols worth reviewing today.

Screen Library

Choose from technical, quality, value, dividend, risk, and TradesViz planning playbooks without rebuilding common scans.

Advanced Screener

Build technical, fundamental, and hybrid screens with saved base screeners, editable thresholds, and AI text-to-query conversion.

Analysis workspaces

Turn market data into side-by-side visual evidence.

Pro includes two dedicated charting workspaces for validating technical setups and studying fundamental performance over time.

Pro only

Technical Analysis

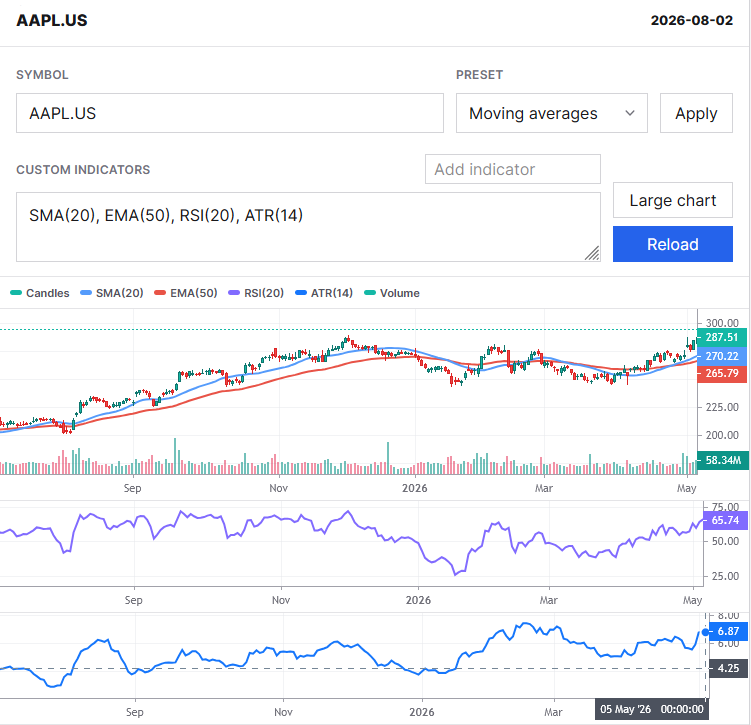
Compare up to eight symbols in one chart grid, choose the EOD date and history range, and apply editable indicator presets independently to every chart.

Technical Analysis workspace showing AAPL candlesticks and editable moving-average, RSI, ATR, and volume indicators

Fundamental Analysis

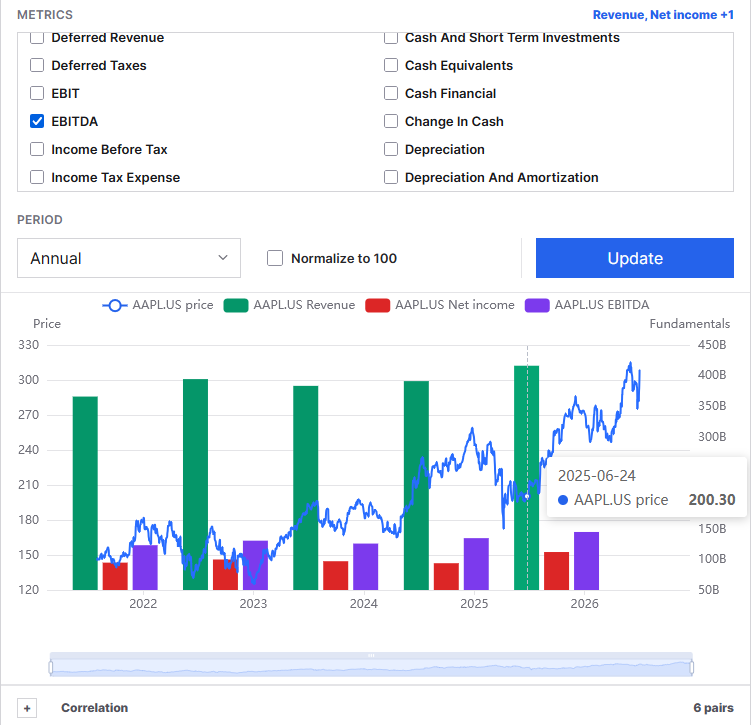
Chart price and company fundamentals across annual or quarterly periods, compare multiple symbols and metrics, normalize series, and inspect correlations.

Fundamental Analysis workspace comparing AAPL price with annual revenue, net income, and EBITDA
Review

Move from matched rows to decisions faster.

Results are not just a flat dump. Queue filters surface priority names, watchlist-ready candidates, and risk-review symbols, then Symbol Review gives the evidence behind each match.

Fundamental screener preview
Fundamental and hybrid research Quality, value, dividend, risk
What is included

Product surfaces built for scanning and follow-through.

Results Insights

Priority, watchlist-ready, risk-review, sector concentration, top names, and concise takeaways for each matched screen.

Review queues
Symbol Review

Dedicated drilldowns with price, move, trend, liquidity, risk, score, technical evidence, fundamental evidence, peers, and exports.

Decision support
Saved Screeners

Saved v2 screens keep readable rule previews, workflow identity, queue links, live result summaries, duplication, and watchlist creation.

Reusable playbooks
Watchlists

Watchlists behave like review queues with EOD snapshots, strongest-name queues, risk queues, sector mix, and one-click symbol review.

Triage
Backtests

Run simple saved strategy checks, open run detail, monitor queued jobs, and export rows while deeper analytics stay intentionally focused.

Validation
TradesViz CSV

Export selected results, watchlists, or single-symbol review rows into a planning CSV for the TradesViz trading journal loop.

Planning
Research coverage

Technical and fundamental fields in one screener.

Use classic technical indicators, nestable functions, canonical fundamental metrics, and hybrid filters in the same research workflow.

Trend and momentum

Moving averages, MACD, RSI, TSI, ADX, crossovers, gap changes, and trend functions.

Volume and volatility

Volume changes, ATR, Bollinger Bands, money flow, OBV-style signals, and range filters.

Quality and value

Profitability, growth, valuation, leverage, cash-flow, liquidity, beta, and balance-sheet metrics.

Dividend and risk

Dividend yield, payout context, debt profile, short-interest fields, drawdown, and tradeability filters.

Markets

Screen major listed equities across four markets.

United States flag
United StatesNASDAQ, NYSE, AMEX
India flag
IndiaNSE and BSE
Canada flag
CanadaTSX listings
Australia flag
AustraliaASX listings
Pricing

One Pro plan for the complete research workflow.

Use the full screener, saved screeners, watchlists, backtests, reference pages, AI conversion credits, and TradesViz CSV export.

Questions

Clear answers before you start.

Do you support intraday screening?

No. EZStockScreener currently works with end-of-day data and updates after market close.

Can technical and fundamental rules be combined?

Yes. The v2 workflow supports technical, fundamental, and hybrid result paths.

Can I request more indicators or markets?

Yes. Send the details through the contact page or email [email protected].

How does TradesViz fit in?

You can export screened symbols or watchlists as a TradesViz planning CSV for journal preparation.

Start

Build a sharper daily stock research routine.

Open the app, pick a workflow, narrow the queue, and review the symbols with evidence.

Start trial