
The v2 Library and References pages are there to answer two different questions.
Screen Library answers: what screens can I run right now?
Indicator Reference and Fundamental Metrics answer: what fields and functions can I use to build or edit my own screen?
Global search connects all of this. You can search once and find symbols, notes, screeners, watchlists, technical indicators, and fundamental metrics from the same top bar.
Screenshot placeholder: V2 top global search showing grouped results for symbols, screen library, saved screeners, watchlists, indicators, and fundamental metrics.
Screen Library
Screen Library is the curated collection of v2 workflows. Use it when you do not want to start from scratch.
The page includes:
- Category filters.
- Mode filters.
- Search.
- Workflow cards.
- Current match counts.
- Backtest summaries.
- Rule previews.
- Actions to view matches, customize, or run a backtest.
Screenshot placeholder: Screen Library page with category rail, search box, mode filters, and screener cards.
Library categories
The category list includes:
- All: Every workflow available for the selected market.
- Momentum: Breakouts, relative strength, volume expansion, and strong trend behavior.
- Pullback: Stocks cooling off inside larger uptrends.
- Quality: Companies with better profitability, growth, returns, or balance sheet signals.
- Growth: Revenue and EPS growth focused research queues.
- Profitability: ROE, margins, operating strength, and related quality checks.
- Valuation: PE, price/sales, EPS, and value-oriented filters.
- Cash Flow: Free cash flow and cash generation based screens.
- Balance Sheet: Debt, current ratio, and financial strength checks.
- Dividend: Yield, payout, and income screens.
- Risk: Weak trend, high beta, short interest, and other caution screens.
- TradesViz: Workflows designed to move clean planning context into TradesViz.
Example: if you want tradeable growth names, start with Quality or Growth. If you want to avoid problematic setups, start with Risk.
Mode filters
The mode filters are:
- All modes: Show every type.
- Technical: Price, volume, trend, and indicator screens.
- Fundamental: Company metric screens.
- Tech + fundamentals: Combined screens that use both chart and business context.
Example: searching for dividend with mode Fundamental gives a research list. Searching with mode Tech + fundamentals gives a more tradeable dividend workflow because trend and liquidity checks are included.
How to read a library card
A library card tells you what the screen is trying to do before you run it.
Screenshot placeholder: Single Screen Library card with category, best for, mode, difficulty, current matches, backtest summary, rule set, and actions.
Important fields:
- Category: The main idea behind the screen.
- Best for: The intended use case, such as swing trading or fundamental research.
- Mode: Technical, Fundamental, or Tech + fundamentals.
- Difficulty: Beginner, Intermediate, or Advanced.
- Current matches: How many stocks currently match.
- Backtest: A quick historical summary where available.
- Rule set: The main logic, written in plain language.
Example: 20-Day High With Volume is a beginner technical screen. It looks for close near 20-day high, volume above the 20-day average, and price above 50 SMA. If you only want tradeable breakouts, that is a reasonable start.
Screen Library examples
Momentum example: Search for volume. Open 20-Day High With Volume. Use View matches. In Results, start with the Priority queue.
Pullback example: Filter category to Pullback. Open Uptrend Pullback to 50 SMA. Customize it if you want stricter liquidity or a higher minimum score.
Quality example: Search ROE. Open Quality Growth in Uptrend. This combines ROE, revenue growth, price trend, and liquidity.
Value example: Filter category to Valuation. Open Reasonable Value With Earnings. This is useful when you want profitable companies with valuation limits.
TradesViz example: Filter category to TradesViz. Open TradesViz Planning Queue. Use the result table to export a plan CSV with screen context.
Indicator Reference
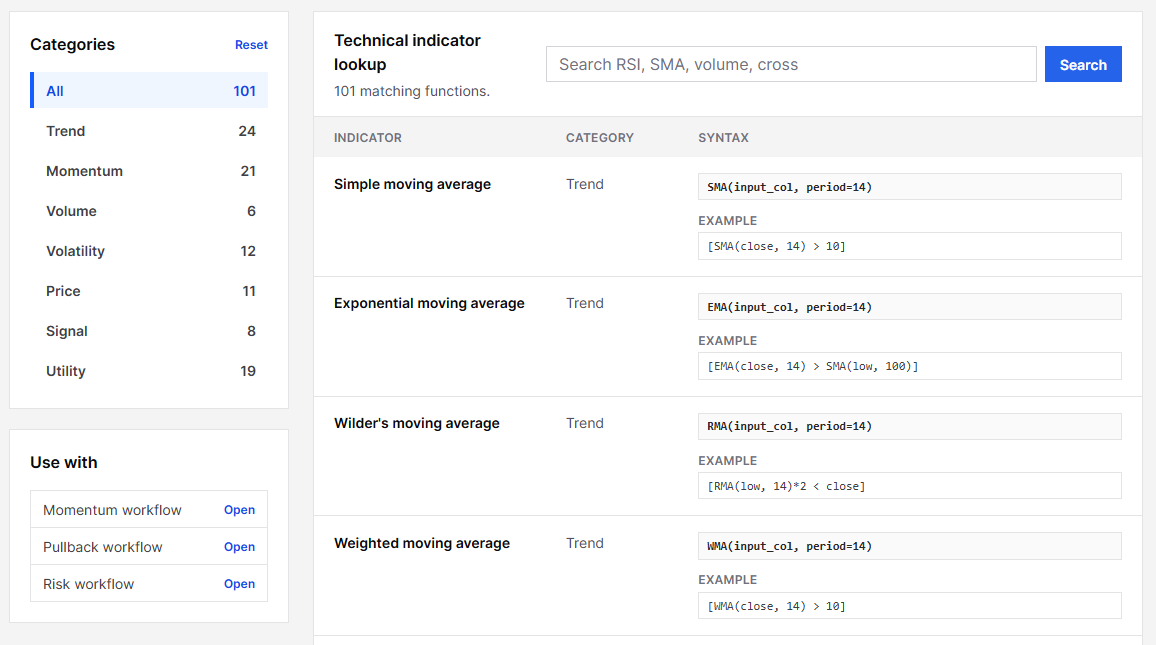
Indicator Reference is the lookup page for technical functions. Use it when you want to write or edit technical rules.
Screenshot placeholder: Indicator Reference page with category filters, search box, syntax table, and common starts panel.
The page includes:
- Technical categories.
- Search.
- Indicator name.
- Category.
- Syntax.
- Example where available.
- Links back to builder workflows.
Useful searches:
- SMA for moving average logic.
- RSI for momentum and pullback logic.
- volume for participation filters.
- cross for crossover logic.
- MACD for MACD line and signal behavior.
Common technical starts shown in the reference include:
[RSI(14) > 60]
[volume > SMA(volume, 20)]
The reference is not just documentation. It is a way to reduce trial and error while building screens.
Fundamental Metrics
Fundamental Metrics is the lookup page for company fields. Use it when building quality, value, dividend, balance sheet, growth, profitability, or cash flow screens.
Screenshot placeholder: Fundamental Metrics page with category rail, metric lookup table, and screening sequence panel.
The page includes:
- Metric categories.
- Search.
- Metric name.
- Category.
- Description.
- Builder shortcuts for quality and hybrid screens.
Useful searches:
- revenue for growth screens.
- margin for profitability screens.
- debt for balance sheet screens.
- dividend for income screens.
- PE for valuation screens.
- ROE for quality screens.
- cash flow for cash generation screens.
A practical fundamental sequence is:
- Start with quality: profitability, margins, cash flow, and debt.
- Add valuation: PE, price/sales, book, or enterprise value fields.
- Add timing: use technical filters before turning the result into a watchlist.
Example: a strong business with poor timing may still be useful, but it may belong in a watchlist rather than a trade plan. A hybrid screen helps separate those cases.
Global search
The top search bar is a global search across the v2 workspace. It searches more than one page at the same time.
Global search can return:
- Symbols: Opens Symbol Review.
- Symbol notes: Opens a symbol with note context.
- Screen library: Opens matching curated screens.
- Saved screeners: Opens matching saved screens.
- Watchlists: Opens matching saved watchlists.
- Indicator reference: Opens technical lookup results.
- Fundamental metrics: Opens metric lookup results.
Screenshot placeholder: Global search dropdown with grouped result sections and keyboard-highlighted first result.
Global search examples
Search: AAPL
Use this when you want to jump directly to Symbol Review for Apple. If the symbol exists for the selected market, the symbol result opens the review page.
Search: RSI
Use this when you need an RSI syntax reminder or want to find pullback screens that use RSI-style logic. Results can include Indicator Reference entries and Screen Library workflows.
Search: dividend
Use this when you want dividend screens, dividend watchlists, or fundamental dividend fields. This is faster than checking Screen Library and Fundamental Metrics separately.
Search: ROE
Use this when building quality screens. You may see quality workflows, saved screeners that use ROE, and fundamental metric entries.
Search: weekly-review
Use this when your watchlists and saved screeners use consistent tags. The search can bring back matching saved work.
How to use Library and References together
Here is a practical way to use these pages without wasting time:
- Start in Screen Library and find the closest existing workflow.
- Open its matches and check whether the result quality is close to what you want.
- If not, click Customize.
- Use Indicator Reference for technical functions you want to add.
- Use Fundamental Metrics for company fields you want to add.
- Save the customized screen with a clear name.
- Use global search later to reopen the screen, metric, symbol, or watchlist.
Example: you want profitable dividend stocks that are not in weak trends. Start with Dividend Yield With Payout Discipline. Customize it. Use Fundamental Metrics to check payout and yield fields. Add a technical trend filter in Advanced Screener. Save it as Dividend payout plus trend review. Later, search "dividend payout" from the top bar and reopen the saved screen.
The main point is simple: the library gives you a usable starting point, the references help you make it precise, and global search keeps the whole workflow reachable.